
Methodology
Try the tool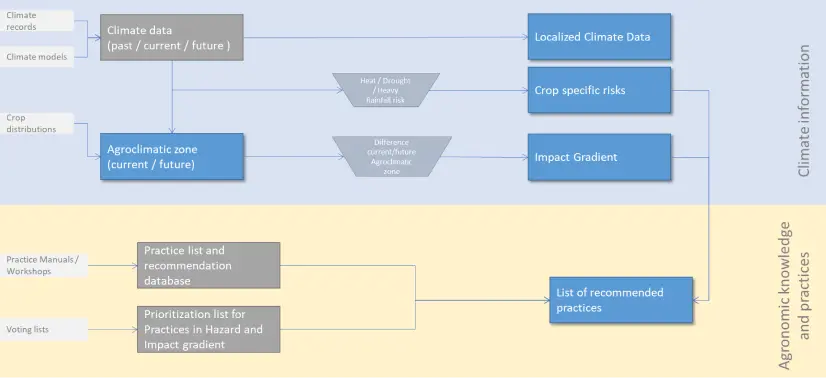
Data sources
The platform connects (1) climate information from past analysis, trend analysis for near casting and future projections with (2) climate-smart farming practices for actionable advice and strategic planning.
-
Climate analysis
For the climate analysis, several major datasets have been developed: past (record) and future (projection) site-specific climate data (interpolated at 5 x 5 km, which allows interpretation at municipality/district level) and reclassified bioclimatic suitability data to define agro-climatic zones for the different crops (cocoa, coffee and tea) that, when projected towards the future, are then used to determine local adaptation zones.
-
Climate data
The climate analysis was based on the globally gridded climatologies of: WorldClim,CHIRPS/CHIRTS and AdaptationAtlas data, and for projections on the Global Climate Model outputs (esp. CMIP5 and CMIP6), downscaled and corrected for bias. Additionally, data on solar radiation is obtained from the Global Aridity and PET Database to be included when calculating rainy seasons.
We use the CHIRPS/CHIRTS data set in the time periods of 1990−2022 (CHIRPS) / 1995−2014 (CHIRTS) for past analysis and 2023−2025 for near cast trend analysis to display past and current precipitation and temperature data. This data is also used when calculating the PET (Potential evapotranspiration) values that determine when dry and wet seasons are shown. Data from the AdaptationAtlas is used when analysing past and future climatic risks factors for crops and humans. Here, we compare the 1995−2014 time period (‘past’) with the 2026−2055 period (‘future’). To determine the agro-climatic zones, we used the WorldClim dataset, with 1970−2000 as our reference framework (‘past’). All future projections are based on CMIP6 and its very high-emissions scenario (SSP 5−5.85) However, when projecting ACZs we used only high-emissions scenarios (CMIP6 – SSP 3−7.0 (tea) and as well as the CMIP5 – RCP 6.0 for cocoa and coffee. In the different datasets we use different future projection time periods. CHIRPS/CHIRTS data is projected to 2026−2055. The AdaptationAtlas data is projected to 2026-2055 as a future time period. Meanwhile, the projection of WorldClim data combines two different futures, 2020−2049 and 2040−2069. (See also Figure 3 below). For full documentation, visit the Github respository
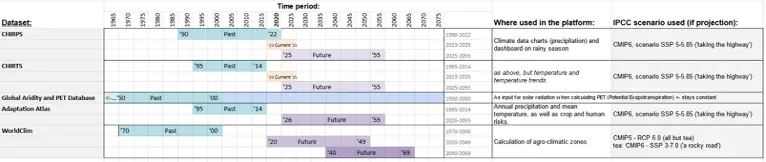
Figure 3. Overview chart showing the underlying datasets and time periods used for calculating climate data and suitability shown on the platform. -
Agro-climatic zones and Adaptation zones:
To determine the adaptation zone classification, we first defined country-specific agro-climatic zones (ACZs) for each crop, based on the current distribution of the crop and the bioclimatic variables present in the locations where the crop is farmed. Each ACZ describes climatic conditions that are considered suitable for farming the crop. These zones are all considered suitable, but their climatic characteristics differ. Then, projecting ACZs into the future and comparing current and future distribution of these ACZs, an impact gradient can be calculated and translated into the corresponding adaptation zones’ classification (in increasing order of severity of change): incremental adaptation, systemic adaptation and transformational adaptation.
Incremental adaptation zones are those regions where no change in agro-climatic zones is expected and climatic suitability is maintained. Systemic adaption zones experience shifts from one agro-climatic zone to another, but are likely to remain within the known range of climatic suitability for that specific crop. Transformational adaptation zones are regions that are expected to shift from one agro-climatic zone for that crop to a non-suitable (or not known to be suitable) climate for that crop and are therefore likely to fall out of productivity.


As is the case for any future outlook, these models have a considerable degree of uncertainty and should be considered projections, not predictions.
It is also important to note that the Global Climate Models currently available show a high level of agreement on an increase in temperature, but disagreement about the regional and seasonal distribution of precipitation. The resulting consensus model of the independent projections is therefore, to a large degree, influenced by the temperature increase, while precipitation disagreement is masked.
-
Climate data
-
Climate-smart farming practices
The practices chosen for the platform are meant to be readily available, locally acceptable and capable of increasing the climate resilience of the given perennial crop production system. First, applicable practices were identified and then restructured into a standard reporting format. Where applicable, variations of the practice were identified to provide more detailed advice under specific climatic situations, e.g., where the risk of drought or heavy rainfall is high. Finally, in collaboration with local stakeholders, we assigned a score to each of the practices, prioritizing practices in each of the adaptation zones and under different climate-hazard situations. The resulting score then determines which practices or practice variations are shown for the specific location selected by a user.
Where available, practices were taken from existing repositories of climate-smart practices (cocoa, especially Côte d’Ivoire and Ghana); for other countries, practices have been cross-adapted and re-evaluated by local experts (Nigeria and Cameroon). In the case of Kenya and Uganda, the Rainforest Alliance and the Alliance of Bioversity and CIAT held two in-person workshops with posterior expert evaluation to identify applicable practices for the local farming systems (coffee and tea). See also the about page for a listing of the major farming manuals used in the selection and description of the climate-smart practices.
For each practice, experts assigned a score to the categories of (i) the different adaptation zones (incremental, systemic or transformational), and (ii) climate hazard (drought, high temperatures and heavy rainfall).
Within the tool, first a rank is calculated that determines whether or not a practice will be shown to the user and in which order practices are shown for a specific location. The actual recommendation text that describes the practice is then assembled from pre-defined building blocks of (i) general practice description, (ii) its variation across the adaptation zones, (iii) extra tips according to applicable local climate hazards, and (iv) the farmer level.